Introduction: The Number That Runs the World
Every few months, a single data release moves financial markets, shifts political narratives, shapes central bank decisions, and influences interest rates on mortgages, car loans, and savings accounts across the country. That release is the GDP report. Yet for most people, Gross Domestic Product remains a vague, abstract concept — something economists and newscasters reference without ever explaining what it actually measures, why it matters, or how it connects to the financial decisions of everyday households.
According to the U.S. Bureau of Economic Analysis, real GDP increased at an annual rate of 2.2 percent in the second quarter of 2026, with the main contributors being consumer spending, investment, and exports. That single figure shaped headlines, influenced Federal Reserve policy discussions, and rippled through every corner of the financial system — all before most Americans had their morning coffee.
This guide explains exactly what GDP is, how it is calculated, what it does and does not tell us, and — most importantly — why it has direct, tangible consequences for your personal financial life.
What Is GDP?
Gross Domestic Product (GDP) is the total monetary value of all finished goods and services produced within a country’s borders during a specific time period — typically measured quarterly and annually. It is the most widely used single indicator of the size and health of an economy.
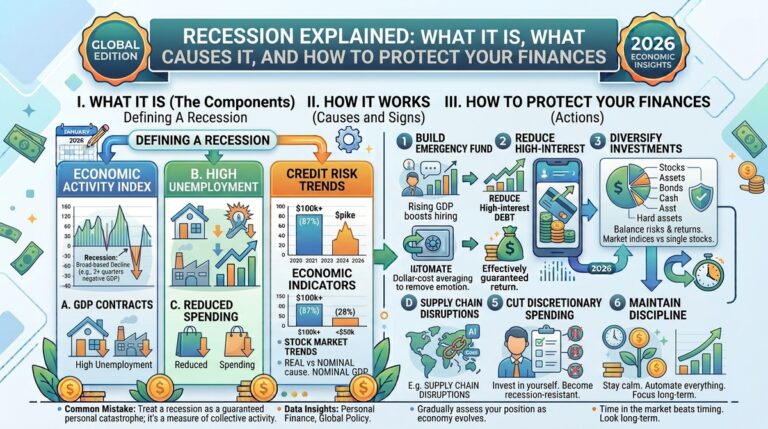
Think of GDP as the economy’s scorecard. When GDP is growing, businesses are producing more, workers are earning more, and spending is expanding. When GDP contracts for two consecutive quarters, the economy is formally in recession — a signal that typically brings higher unemployment, tighter lending conditions, and reduced household wealth.
It is important to note what GDP measures and what it does not. GDP captures economic output — the volume of production and transaction activity. It does not measure quality of life, income inequality, environmental sustainability, or individual well-being. A country can grow its GDP while simultaneously experiencing rising poverty or declining life satisfaction. Understanding this distinction prevents GDP from being over-interpreted as a comprehensive measure of national prosperity.
How Is GDP Calculated? The Four Components
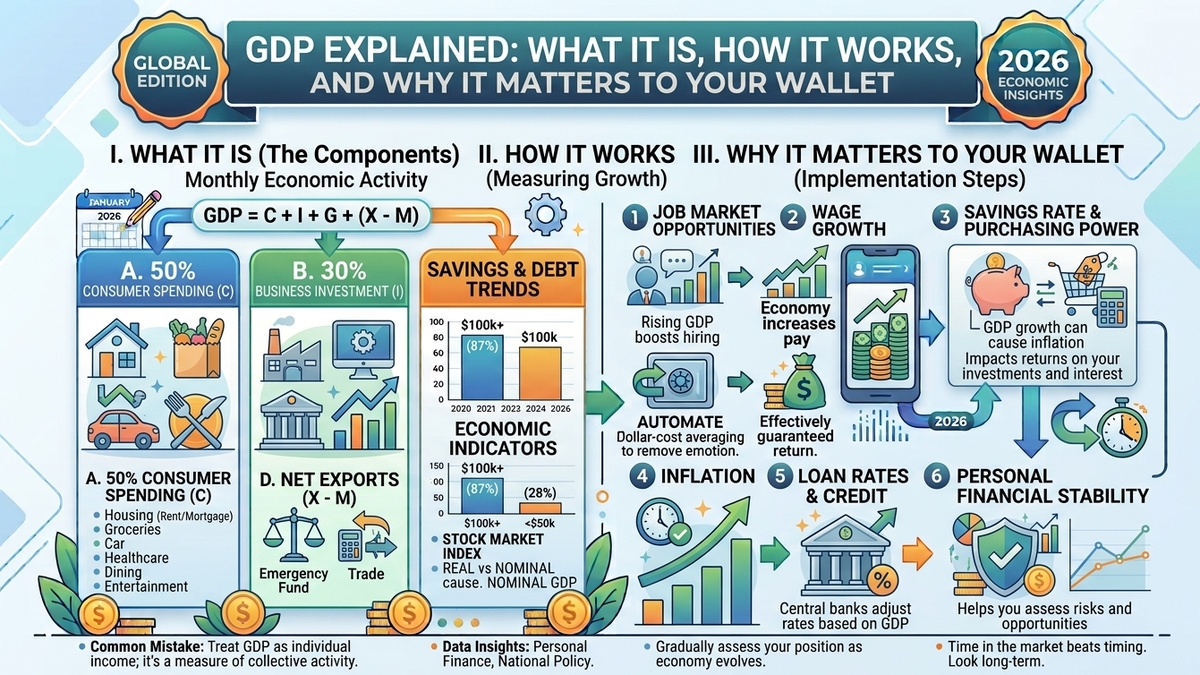
Economists use a standard formula to calculate GDP, often expressed as:
GDP = C + I + G + (X − M)
Each letter represents a distinct category of economic activity:
C — Consumer Spending (Consumption)
This is the largest component of GDP in the United States, typically accounting for roughly two-thirds of total economic output. It includes all spending by households on goods and services — groceries, healthcare, housing, entertainment, clothing, and everything in between. The increase in real GDP in Q2 2026 reflected contributions from consumer spending alongside investment and exports, reaffirming consumption as the engine of U.S. economic growth.
I — Investment
This component captures business spending on capital goods — equipment, machinery, buildings, and technology — as well as residential construction and changes in business inventories. Among the leading contributors to investment growth in Q2 2026 were nonresidential structures, primarily driven by investment in data centers as well as broader construction in the commercial and healthcare sectors.
G — Government Spending
This includes all federal, state, and local government expenditures on goods and services — military spending, infrastructure, public education, healthcare programs, and government employee salaries. Transfer payments such as Social Security or unemployment benefits are not counted in GDP directly, as they are not payments for goods or services produced.
X − M — Net Exports (Exports Minus Imports)
Exports add to GDP because they represent goods and services produced domestically and sold abroad. Imports subtract from GDP because they represent spending on foreign-produced goods rather than domestically produced output. When a country imports more than it exports — as the United States consistently does — this “trade deficit” acts as a drag on the GDP calculation, which is why import levels are closely watched alongside the headline growth figure. In Q2 2026, imports increased and acted as a partial offset to the growth contributions from consumer spending, investment, and exports.
Nominal GDP vs. Real GDP: Why the Distinction Matters
One of the most important — and most frequently confused — distinctions in GDP analysis is the difference between nominal and real GDP.
Nominal GDP measures the value of economic output at current prices, without adjusting for inflation. If prices rise across the economy, nominal GDP will increase even if the actual volume of goods and services produced stays the same.
Real GDP adjusts for inflation, providing a more accurate picture of whether the economy is actually producing more output or simply charging higher prices for the same output. When economists and policymakers refer to economic growth, they are almost always referencing real GDP growth — the figure that reflects genuine expansion in productive capacity.
This distinction matters enormously in inflationary environments. During periods of elevated consumer prices, nominal GDP can appear robust while real GDP growth — and by extension, real household purchasing power — is far more modest.
GDP Per Capita: Measuring Individual Economic Standing
While total GDP measures the size of an economy, GDP per capita — total GDP divided by the country’s population — provides a more meaningful benchmark for comparing living standards across countries.
The United States has a nominal GDP of approximately $32.38 trillion in 2026, with a GDP per capita of $94,430 — placing it among the highest in the world. This figure reflects the high productivity and output per worker that characterizes the U.S. economy, driven by advanced services, technology, finance, and healthcare sectors.
However, GDP per capita is itself an average — and averages can obscure significant internal inequality. A country where GDP per capita is $60,000 may have a small number of very wealthy households and a large number of households earning far less, making median income a more useful supplement to GDP per capita when assessing broad living standards.
The U.S. GDP in Global Context
Understanding where U.S. GDP stands relative to other economies provides important context for how global financial and trade dynamics affect domestic economic conditions.
Global GDP reached approximately $125 trillion in nominal terms in 2026, according to the IMF’s April 2026 World Economic Outlook. The United States leads at about $32.4 trillion — roughly 26 percent of total global output — ahead of China at $20.9 trillion, Germany at $5.45 trillion, Japan at $4.38 trillion, and the United Kingdom at $4.26 trillion.
China ranks as the world’s largest economy by purchasing power parity (PPP), while the United States remains the leader by nominal GDP. This distinction matters because PPP-adjusted figures account for price level differences between countries — a dollar of GDP in China buys considerably more in domestic goods and services than a dollar of GDP in the United States, making PPP a more useful measure for comparing actual living standards across nations.
India, ranked sixth by nominal GDP at approximately $4.15 trillion, is the fastest-growing among the world’s largest economies, with a growth rate of 6.48 percent — supporting expectations of continued upward movement in global rankings in the years ahead.
GDP Growth, Recessions, and What They Mean for You
GDP growth figures directly influence the decisions made by the Federal Reserve, government policymakers, businesses, and lenders — and through those decisions, they shape the financial environment that every household navigates.
When GDP Is Growing
Robust GDP growth typically signals:
- Lower unemployment and stronger hiring as businesses expand
- Higher consumer confidence and spending
- Increased business investment and capital spending
- A Federal Reserve more likely to maintain or raise interest rates to prevent overheating
When GDP Is Contracting
A contracting GDP — particularly two consecutive quarters of negative real GDP growth, the technical definition of a recession — typically brings:
- Rising unemployment as businesses cut costs
- Tighter credit conditions as lenders reduce risk
- Falling consumer spending and business investment
- Federal Reserve rate cuts aimed at stimulating economic activity
- Potential declines in housing prices and equity markets
The current year-over-year rate of real GDP growth stands at 2.66 percent — at or below the level observed at the start of six of the twelve recessions tracked since 1947, underscoring the importance of monitoring GDP trends rather than treating any single quarterly figure as definitive.
The Limits of GDP as a Policy Guide
GDP growth does not guarantee that prosperity is broadly shared. The 10-year moving average of U.S. GDP growth has remained below the historical long-run average of 3.19 percent since 2007 — a signal of a significant deceleration in economic expansion since the Great Recession that has coincided with widening wealth inequality and stagnating real wages for many households even during periods of headline growth.
This is why economists increasingly supplement GDP with additional indicators — unemployment rates, wage growth, consumer sentiment, and measures of household financial health — to form a more complete picture of economic conditions.
GDP and Personal Finance: The Direct Connection
While GDP can seem like a macroeconomic abstraction, its behavior has concrete and immediate effects on the personal financial decisions that matter most:
- Interest rates — The Federal Reserve adjusts its benchmark interest rate partly in response to GDP trends. Slowing growth typically leads to rate cuts, which reduce borrowing costs on mortgages, auto loans, and credit cards. Strong growth may trigger rate increases, raising those same costs.
- Employment and income — GDP growth drives hiring, wage growth, and job security. Periods of GDP contraction typically bring layoffs and income stagnation.
- Investment returns — Equity markets broadly track long-term GDP growth expectations. Sustained GDP expansion supports corporate earnings growth, which in turn supports stock market appreciation over time.
- Inflation — Rapid GDP growth can overheat the economy and accelerate inflation, eroding household purchasing power even as headline growth looks strong.
- Government fiscal policy — Tax revenues rise with GDP growth and fall during contractions, influencing the scale of public investment in infrastructure, education, and social programs.
Conclusion: GDP Is the Backdrop to Every Financial Decision You Make
GDP is not an abstraction reserved for economists and central bankers. It is the single broadest measure of the economic environment within which every job offer, loan application, investment decision, and household budget operates. Understanding what drives GDP growth, what signals contraction, and how the distinction between nominal and real GDP affects the interpretation of headline figures gives you a meaningful analytical edge in understanding the financial news that shapes your daily life.
With the U.S. economy growing at a 2.2 percent annualized rate as of Q2 2026 — a solid but below-trend pace — the emphasis for households should remain on building financial resilience: maintaining a budget, keeping an emergency fund, managing debt strategically, and investing consistently for the long term regardless of where the GDP cycle happens to be at any given moment.
Want to apply macroeconomic awareness to your personal finances? Read our related guides on budgeting, investing, and debt management — understanding the big economic picture makes every personal financial decision more informed and more effective.